Circle Graph
|
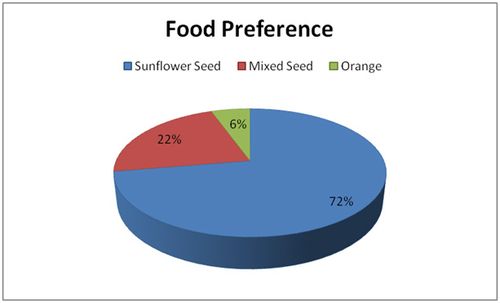
Pie charts are best to use when you are trying to compare parts of a whole. They do not show changes over time. In the example on the right, the this student took the entire food group of sunflower, mixed and orange seeds and showed how popular they were with the birds by constructing this circle graph. |
|
